You don’t need a pricey BI stack to build decision-grade marketing reporting. You need a simple pipeline that:
- pulls data consistently
- stores it in one place
- makes it easy to compare channels
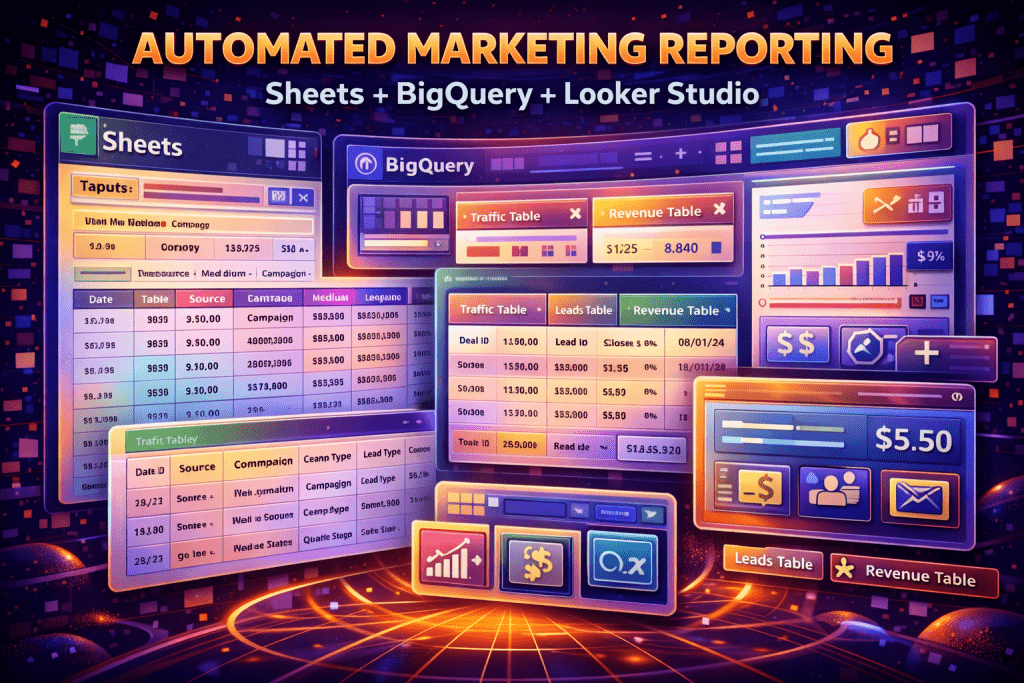
The Lightweight Stack
- Sheets: inputs + mappings + manual notes (campaign taxonomy, lead quality labels)
- BigQuery: central storage + joins + history
- Looker Studio: dashboards for decision makers
What to Track (So the Dashboard Matters)
- Spend, clicks, impressions (PPC)
- Leads and qualified leads (calls + forms)
- Email opt-ins + key sequence outcomes
- Revenue (if available) or pipeline value
The Data Model That Makes Reporting Easy
- traffic table: date, source, medium, campaign, clicks, cost
- leads table: lead_id, date, source/medium/campaign, lead_type, qualified_status
- revenue table: deal_id, lead_id/contact_id, revenue, closed_date
Where Sheets Fits (The Secret Weapon)
Sheets is perfect for:
- UTM naming conventions
- campaign-to-service mappings
- lead scoring rules
- manual “reason not qualified” categories
Automation Options (Pick One)
- Native connectors (when available)
- Scheduled exports + load to BigQuery
- Lightweight scripts (Apps Script / Cloud Functions)
What a “Decision Dashboard” Should Answer
- Cost per qualified lead by channel/campaign
- Qualified rate by landing page
- Trends week over week
- Revenue/pipeline by source (when possible)
Bottom Line
You can build automated reporting that drives decisions with a simple stack. The key is consistent naming, a clean “qualified lead” field, and one central place (BigQuery) to join everything.